The growth of the dollar-yen – a false hope?
Last week, the dollar rose to a four-month high against the Japanese yen, sparking conversations among investors as to whether this will be sustained upward trend, or is it another false hope. Chart analysis speaks in favor of the latter.
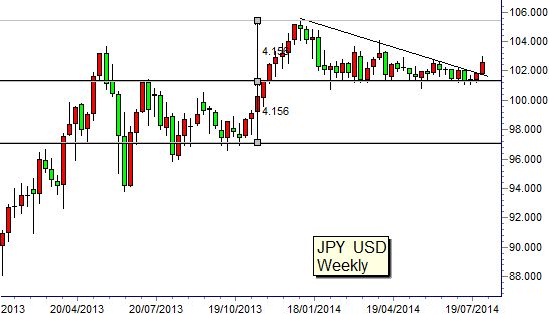
Patterning of a descending triangle in the dollar-yen pair implies a high probability of departure to around 97; such patterns are usually “bear.” However, the pair did break above the downtrend line, which sets the goal of potential growth in the mark of 105.5. The level of support was established in February 2014 and since then, the couple often it is tested.
The downtrend started with maximum 105.4 in January 2014 This is a clear trend line, and the dollar-yen repeatedly deviated from it in the last 6 months.
The basis of the triangular pattern formed due to the fact that the price action consistently move in the same direction. All candles – one color.
Descending triangle pattern is part of the pattern of trade corridors. The first starts with a support in the region 97.5, whereas the resistance – in the region of 101.5. The width of this trade corridor narrowed to set up a breakthrough goal. Target level – in the area of 105.5, the maximum in January 2014.
This proves that the analysis of the trade corridor – the most effective graphical model for the dollar-yen pair. Descending triangle formed within this corridor.
Descending triangle pattern with a probability of 70% indicate the break down. That also means that a 30% chance it could be argued that a break down is not going to happen. In this case, the most common consequence is the lateral movement of prices on the level of support. Very rarely, the price goes up during the upward breakout within a descending triangle pattern.
Objectives break the triangular pattern is calculated by measuring its foundation and subsequent projection prices from the breakout point on the trendline. On the graphical model dollar-yen is a breakthrough in the area of the top of a triangular pattern.
The purpose of price projections – in the area of 105.5, which coincides with the projection of the price of commercial corridor.
A break above the downtrend line has little chance of success. This means that the likelihood that a breakout will reach targets upward projections near 105.5 – extremely low. It is the goal of weak growth, low pulse, so the likelihood is high that this growth will not be able to reach the target level of 105.5. Traders are very careful and put a tight stop-loss trading the breakout.